
Content:
It’s taken a while, but the M.2 standard finally appears to have taken hold of the SSD market. Pretty much all new motherboards come with at least one M.2 slot. New consumer devices, such as the latest generation of games consoles, come with M.2 drives either fitted as standard or an expansion slot to add a drive later on.
That said, the switch to a single connector standard (albeit featuring a few different designs) has rather muddied the waters when it comes to performance.
With both SATA and the newer PCIe-based NVMe drives using the M.2 connector, along with different NVMe generations to consider, buying a drive is much less straightforward than it once was.
Having a few different M.2 drives, a couple of which are currently not being used (despite having a a pair of mechanical HDDs still in use), I thought it would be interesting to run a simple benchmark on the drives to compare them.
A Quick Tech Intro
There’s a lot of technical jargon involved when buying an M.2 drive. We’ll go over a few common points here.
SSD NAND chips, which are the chips which store data, generally come in four main formats. There’s SLC, which holds a single bit per data cell. MLC doubles this to two bits per cell, TLC stores three per cell, with QLC using four bits per cell.
Theoretically, SLC should be faster and provide greater endurance, due to each cell holding a smaller amount of data. It is, however, more expensive.
At the other end, QLC is cheaper, while providing slower speeds and lower endurance, owing to multiple bits of data being written to the same cell.
Drive capacity is a sometimes overlooked factor which impacts performance results. You can guarantee that the headline advertised performance used in marketing material will apply only to the largest capacity available.
If you’re buying a 128GB drive, which comes in variants up to 2TB, you can guarantee the advertised speeds will be for the 2TB version. And your 128GB drive will often come in with much lower figures than the larger drive.
This occurs because a large drive will use a greater number of physical NAND chips, each of which can be accessed in parallel. In reality, this is a rather over-simplified explanation which ignores a few other factors, but is enough for this article.
The presence (or otherwise) of a DRAM cache is another consideration usually mentioned in SSD reviews. A large cache acts as a buffer, with much greater performance than the actual NAND on the drive. Writing to the drive first fills up the cache, which the drive empties as it writes data to the NAND storage. This should improve performance, at least until it’s full.
Entry-level drives generally don’t include this cache, which could impact performance. There may be alternatives used, such as a small amount of SLC NAND, to boost performance while keeping the cost low.
With that out of the way, lets get benchmarking.
Benchmarks
Five different M.2 drives were benchmarked and compared. Four of the drives are NVMe, the other being SATA. They’re outlined in more detail below.
Where manufacturer stated speeds are stated, these are for the specific capacity of the drive, rather than the headline speed for the series.
Each drive was tested using the GNOME disk utility benchmark tool, on a live version of Ubuntu 22.04 LTS.
Each test used a 1000 samples of 10MiB each, with both read and write speeds tested.
Different workloads will give different results, so these values shouldn’t be taken too literally. Drive capacities are also different, which will make a difference to the results. That said, they should give a good idea of the performance of each drive relative to one another.
Drive 1 – Samsung EVO 960
The first drive is a Samsung EVO 960. It’s a couple of generations old now, but Samsung has always had a reputation for creating fast drives.

Featuring an M M.2 key, the drive has access to 4x PCIe lanes. The drive also has a 512MB LP DDR3 cache. Quoted speeds are 3,200MB/s sequential read, and 1,800MB/s sequential write.

Performance here doesn’t match the quoted figures. In fact, it doesn’t even peak at the expected values.
Peak write speeds are still within SATA capabilities. Towards the end of the test, write speeds dipped to around 50MB/s.
A little disappointing, though this drive has seen by far the most use out of any of the drives in this test.
Drive 2 – Kioxia KBG40ZMT128G
The second drive benchmarked is a Kioxia KBG40ZMT128G 128GB NVMe drive. This drive uses the 2242 form factor, which is required in some devices though is not the shortest M.2 form factor available. The drive may also be available labelled as Toshiba, who spun off their memory division as Kioxia back in 2018.
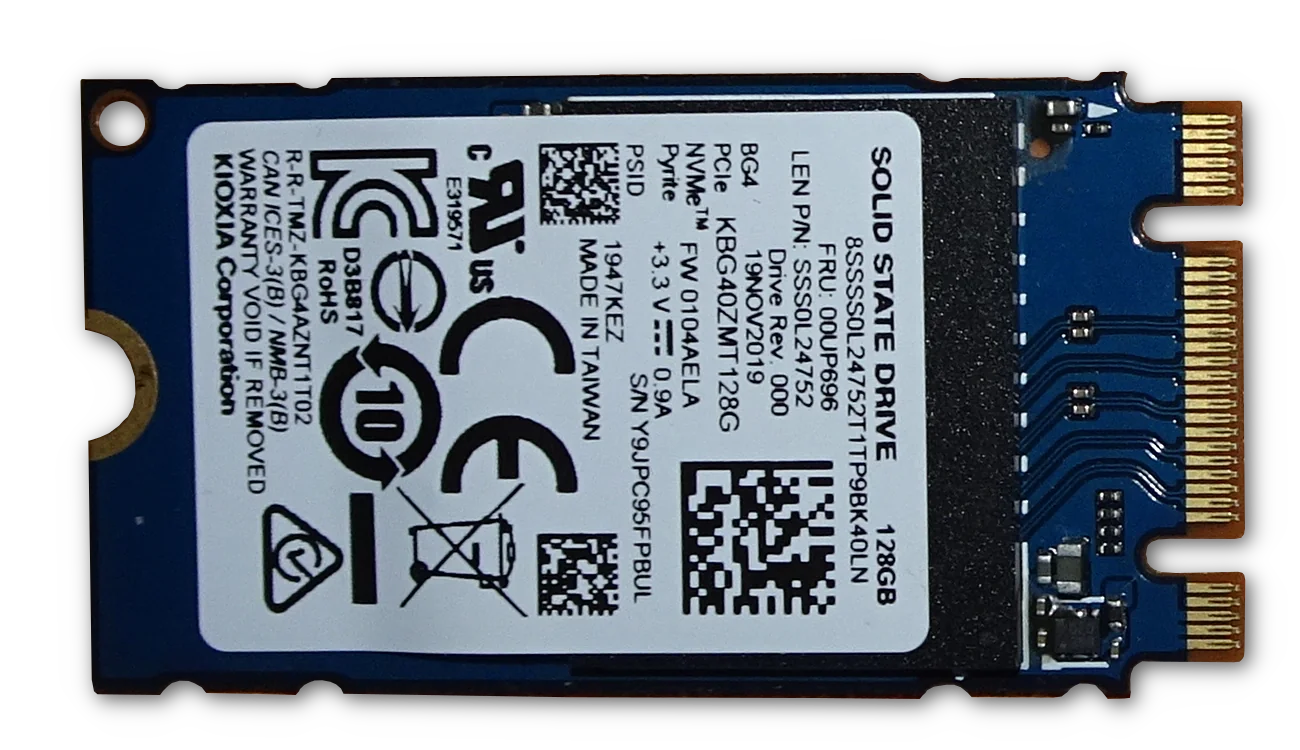
This drive uses the B&M M.2 key, which means the NVMe interface has access to a maximum of 2x PCIe lanes. Quoted drive speeds are unavailable; ditto cache information.

The results for the 128GB Kioxia (recognised by the PC as a Toshiba) are, quite frankly, abysmal. While the average read rate is above the 600MB/s SATA III limit, there are huge spikes throughout the test. At times, read rates were as low as 150MB/s.
As for the write speed…we’ve seen microSD cards with faster write speeds than the Kioxia managed towards the end of the test. Maxing out at barely over 100MB/s, the last 30% of the test dipped below 10MB/s most of the time.
There’s a noticeable drop in performance around the 50GB mark, which suggests some sort of caching is present. Not that performance was great prior to this, but it did keep the write speeds steady.
Drive 3 – Western Digital WDS550G2B0C
Drive three is a Western Digital Blue SN550 NVMe drive. It’s a rather sparse-looking drive, with the full-length 2280 form factor largely empty. Indeed, the rear of the drive is totally bare.

This drive uses the M M.2 key, which provides up to 4x PCIe lanes. It utilises 3D TLC NAND cells.
Western Digital list this drive as having up to 2,400MB/s read, and 1,700MB/s sequential write speeds. The drive does not have a DRAM cache, though does have a small amount of SLC NAND contained within the controller chip.
This drive is interesting, as it led to a public statement from Western Digital after accusations they had released a new version of this drive that crippled performance. While the original drive is quoted as reaching 6-800MB/s write speed once the SLC NAND is full, the new drive halves that.

Despite being a ‘budget’ drive, the WD SN550 performed very well in the benchmark.
Read rates are the fastest tested, averaging 3GB/s, and peaking at 3.4GB/s. REad speeds bottomed out at around 2GB/s, a very impressive result.
Write speeds too were great, at least, for the first 50% of the drive. 1 – 1.8GB/s were achieved up until this point, where speeds then dropped to around 300MB/s. Yes, this particular drive is the ‘crippled’ version.
While this is only a benchmark, it does throw a few GB of data at the drive in a couple of seconds. Whether this change makes a difference really does depend on your workload. Unless you too are throwing large amounts of data at the drive, the change is unlikely to make a difference.
That said, it muddies the water further. You can’t necessarily trust that the drive you’re purchasing is the same as the one you’ve seen in a benchmark.
For their part, WD have pledged to use new part numbers in the future whenever this sort of change is made.
Drive 4 – Samsung PM871b
The only SATA drive here, the PM871b is a full-length 2280 drive featuring a B&M M.2 key.
It’s obvious from the design that there are multiple capacities available using the same board, with pads visible for another NAND chip. This would be populated on drives with a larger capacity.
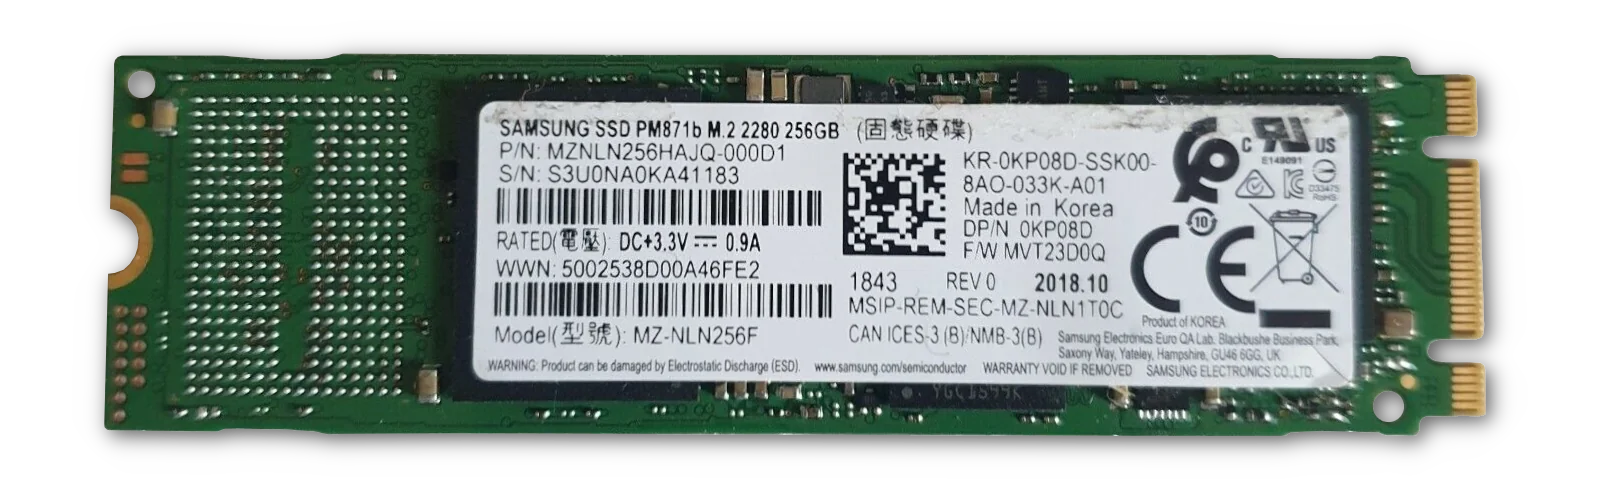
Being a SATA III drive, the maximum theoretical read/write speed will be 600MB/s.
It’s difficult to find information on this drive, but it’s suggested to be similar to the EVO 950.

In the benchmark, the read rates pretty much saturated the SATA III bus throughout the entire test, with speeds being largely consistent. Write speeds are not bad either, peaking at around 500MB/s, albeit less consistent than read speeds.
There’s a noticeable drop off here at around 25%, which suggests a 64GB cache. The drop off only seems to impact write speeds, which remain at a steady and consistent 285MB/s through the rest of the test.
Access time remains mostly below 0.1ms, with some spikes to around 0.3ms.
Compared to the other Samsung drive, this one actually came out on top for average write speed – a reminder that the interface isn’t everything for performance.
Overall, a strong result for a SATA drive.
Drive 5 – SK Hynix BC711
The final drive tested is a tiny Hynix BC711 256GB NVMe drive. Using the 2230 M.2 form-factor, the BC711 is the shortest drive currently supported by the M.2 standard.
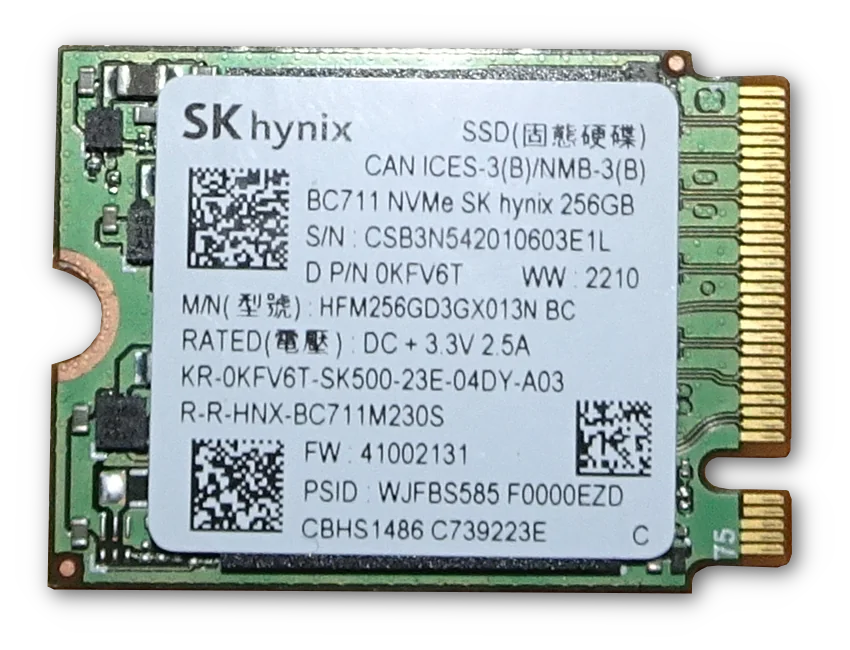
Despite this, it uses the M M.2 key, providing up to 4x PCIe lanes.
This form factor is not widely used for consumer sales, instead being commonly sold to OEMs. This drive label includes the line ‘D P/N’, followed by a 6 character string, which looks very much like a Dell part number. Looks like someone’s Dell product has had an upgrade at some point.
SK Hynix give this drive a rating of up to 2,850MB/s sequential read, and 1,400MB/s sequential write.

The results show average speeds pretty much bang on what SK Hynix have quoted. In fact, the average write rate is higher than the marketing suggests.
Peak write speeds of 1.6GB/s and peak reads of 3.2GB/s make this one of the fastest drives tested. The speed was also remarkably consistent – barring a few drop-offs performance remained at or above 2.6GB/s through the entire run.
Write speeds are the fastest tested. While frequently dropping to around 900MB/s, speeds spent most of the test at 1.6GB/s.
And all of this performance, in a size 2230 drive.
It would be interesting to see how much thermal throttling impacts this drive, given the compact size of the board. Perhaps it’s possible to squeeze out even more performance.
Summary
The table below summarises the results.
| Drive | Type | Cell Type | Avg Read (MB/s) | Avg Write (MB/s) | Avg Access Time (msec) |
|---|---|---|---|---|---|
| Samsung EVO 960 | NVMe | MLC | 649.2 | 234 | 0.42 |
| Kioxia KBG40ZMT128G | NVMe | ? | 739.0 | 54.4 | 0.23 |
| WD WDS550G2B0C | NVMe | TLC | 3000 | 995.8 | 0.03 |
| Samsung PM871b | SATA | TLC | 539.9 | 330.0 | 0.1 |
| SK Hynix BC711 | NVMe | TLC | 2800 | 1500 | 0.04 |
There’s no real pattern here, with the length of the drive and type of NAND cell used seemingly having little impact on the results.
It pretty much demonstrates why buying a decent M.2 drive can be a little more complex than it might appear.
Conclusions
The existence of a DRAM cache (or otherwise) is often cited as a reason to buy one drive over another, with DRAM-less drives usually aimed at the entry-level end of the market. Despite this, the SN550 outperformed the EVO 960, despite the latter having a DRAM cache and the former having none.
That said, the quoted sequential speeds of the EVO 960 are higher than that of the SN550. Tests done by PCMag, which include these two drives (albeit with a 1TB SN550), shows the EVO 960 does come out on top in sequential read and write tests. The SN550, though, came out on top in literally every other test.
What can we take from this? Sequential read/write speeds are used as the headline figure, as they’re faster than random read/write speeds. Real world usage tends not to be sequential, so random read/write speed should be a better indicator of real world performance. Look past the headline figures when buying a drive, and take a look at some real-world benchmarks.
The length of the drive matters little for performance, the only exception being when cooling the drive is necessary (a larger drive will dissipate heat better than a smaller one). The SK Hynix drive had excellent performance, with average writes slightly faster than quoted by the manufacturer.
The Kioxia, by far the most disappointing drive tested, is an OEM drive. While you wont be picking up one of these new, they will show up from time to time in the used market. This demonstrates that, while that new laptop you’re looking at is described as having an M.2 PCIe SSD, you’re not guaranteed to get one that will give good performance. It very much feels as though this drive has been made as cheaply as possible for OEMs to tick a box on a spec sheet, rather than actually improving the device containing it. Even taking into account that it was the drive with the lowest capacity, these results suggest it should be nowhere near any high I/O workloads.
Comparing the SATA-based Samsung to the Kioxia drive, it fares favourably on average, though without the faster peaks the NVMe interface allows. The laptop this drive is usually fitted to (though removed from for testing) is a candidate for an upgrade to an NVMe drive. Swapping in the Kioxia would possibly lower performance of the laptop.
If there’s one take-away from these results, it’s that M.2 drives are not all equal.


